What each bus costs per km, and where the number comes from.
Expenses by category, with receipts, and indicators that show the math. When data is missing, Nória Fleet says so instead of estimating.
How it works
- Maintenance, fuel and tire expenses arrive on their own, linked to their source.
- Record tolls, insurance, taxes, washing and others by hand, with a receipt.
- Cost per km marked Actual, Planned or Insufficient data: nothing is estimated.
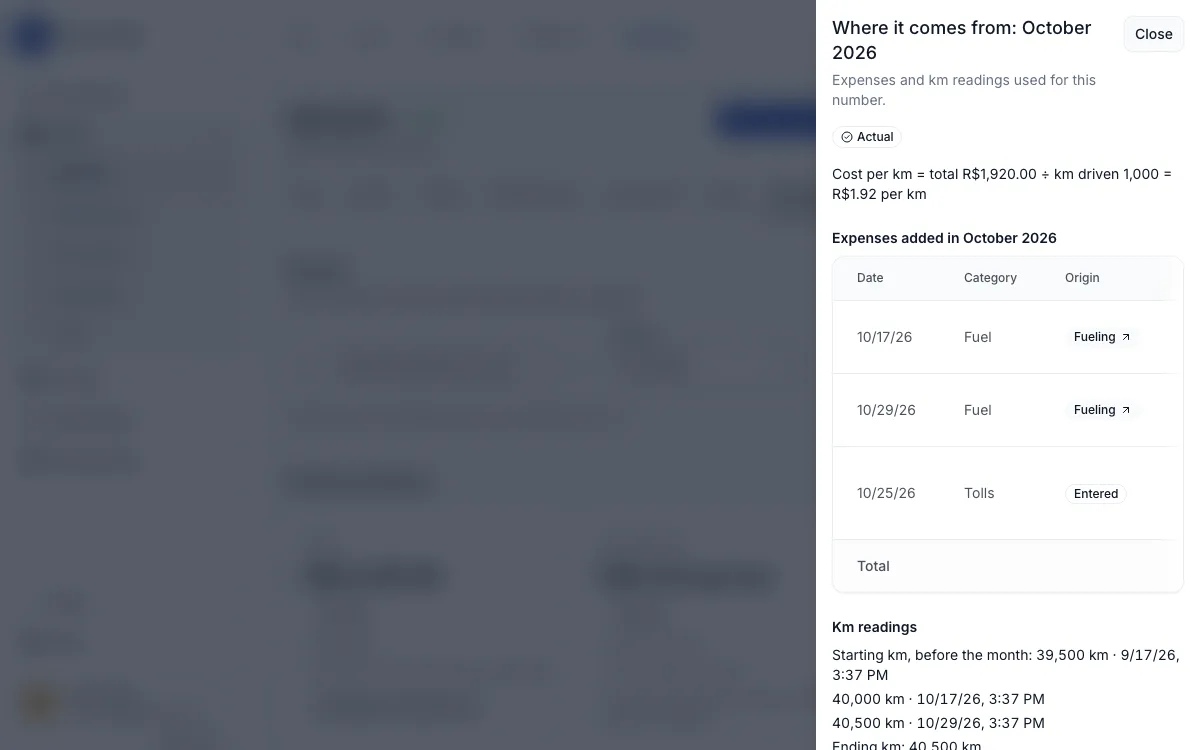
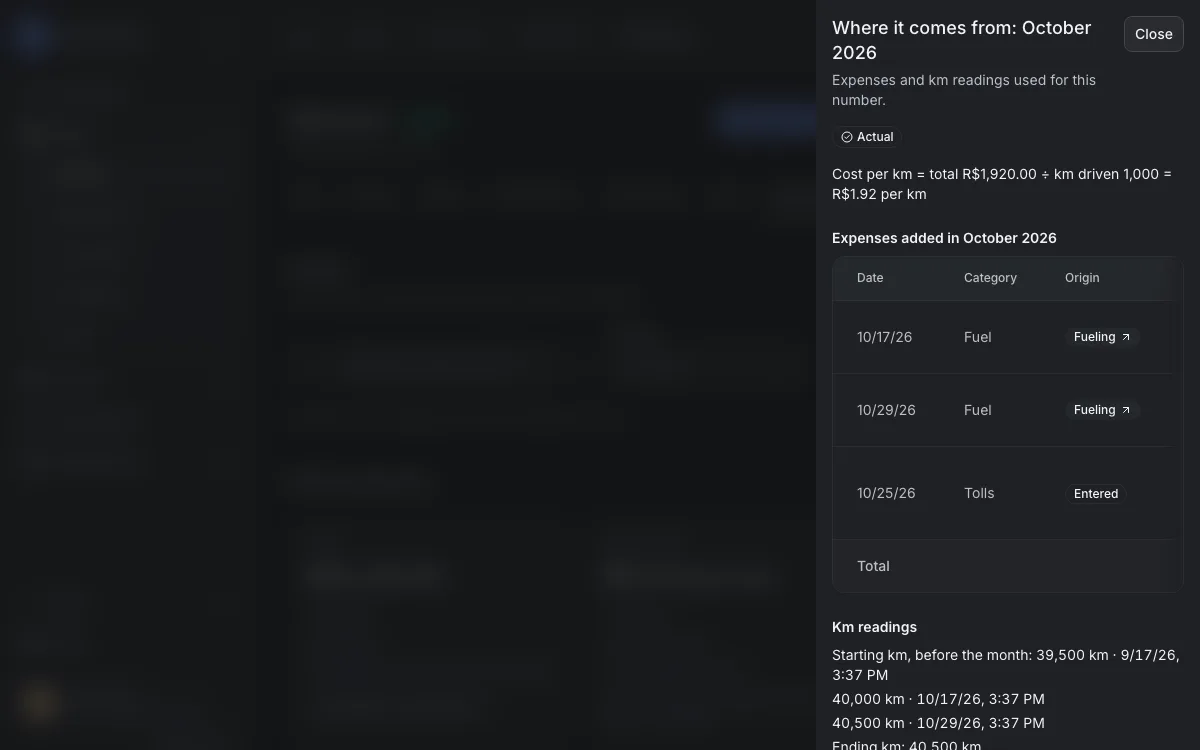
- The "Where it comes from" button opens the formula and the entries used.
- A month outside the pattern is highlighted by an explainable rule, along with the vehicle's position in the fleet.
An example
Step by step
Let the modules record
Maintenance, fuel and tires create the expense on their own, linked to the source.
Record what is missing
In Expenses, record tolls, insurance, taxes or washing, with the receipt.
Read the indicators
See the total, the cost per km and the change against the previous period.
Check the math
Open "Where it comes from" to see the formula and the entries used.
Screenshots
Start with your vehicle records
Create an account and register your fleet.
You confirm your email and create the company next.